What does it all mean?
Performance Rankings
The stats in each “Performance-tracking” section of the Analysis sheet all work together synergistically. Monitoring these stats over time will allow you the following benefits:
- Discover Strengths and Weaknesses.
- Identify unsuccessful Strategies, Methods or Tactics.
- Maintain successful Strategies, Methods, or Tactics.
- A means to Confirm consistency of results, performance and progress.
- Recognize mistakes and errors that are causing present day losses – unlocking future profits.
- … and of course – Improve on this knowledge – by periodically adjusting your Trading plan.
Performance Ranking Terminology
Trading Terminology, as seen in the TJS Analysis sheet.
# of Trades
This is the total number of trades that have been recorded in each of your Performance-tracking sections. The top header will display all Cumulative number of trades.
- Without this figure, it would be impossible to know if your other analysis (Expectancy, Payoff Ratio, etc.) is reliable or not. Before evaluating any strategy, be sure you have at least 20 (# of Trades) or more… the higher the better, as this is considered your trade ‘sample’.
P&L (Profit and Loss)
P&L lists the amount of Profit and Loss for each sub-category in your Performance-tracking sections.
- Although not particularly helpful in evaluation analysis, what would the TJS be without knowing how much you’ve made or lost for each of your strategy types?
Win %
Some call this the “Batting Average” (Baseball terminology). This is simply taking all Winning trades, and then dividing by Total number of trades to come up with a % figure.
This metric does not tell the story when used as a sole means of analysis, as many systems with a high Win % are net losers. The TJS gives you multiple (and synergistic) analysis calculations to verify your performance, and the Win % ratio is just one part of the overall equation.
- e.g. If your Payoff Ratio is under (1.00), you’ll need to have a healthy Win % to compensate (and vice-versa)!
Payoff Ratio (Expectation)
Payoff Ratio* is sometimes referred to as the “Win/Loss Size Ratio”, or “Expectation”.
This ratio is simply the system’s average profit per trade divided by the average loss per trade. The higher the payoff ratio, the better the system.
- To explain further, this is a ratio used by many traders to compare the expected return, to the amount of Capital at Risk undertaken to achieve these returns. The first number in the ratio would represent the average amount of risk in the trade. The second number is the potential reward of the trade (referring to the Avg. profit, to the Avg. loss per trade).
- Example… if you risked an average of $100 per trade and your average profit is $175, then your Payoff Ratio would be, 1 to 1.75 (175 / 100), so the “expectation” in this scenario is — for every $1.00 Risked — a Reward of $0.75 would be earned in return.
- Since trading is all about Reward-to-Risk, it would not be advisable to trade a system with a Payoff Ratio near 1, unless it had a (Win %) greater than 50%.
* Not to be confused with “Profit Factor”, which was present in TJS products prior to November, 2010. It is assumed, by the TJS creator and many feedback requests, that the “Payoff Ratio” best reflects the truer reality of a systems performance – moreso than Profit Factor.
Expectancy
Since profitability cannot be determined from Win % alone, the Expectancy formula provides a means of quantifying your edge over a series of trades.
- (Win % * Avg Wins) – (Loss % * Avg Losses)
A trading strategy that makes money over the trade “sample” will have an expectancy greater than zero. A losing strategy will have a result less than zero.
This figure is important, as one can assume (given a proper data sample size) that they can expect to make this amount going forward as long as their performance remains consistent with prior results. When you find a positive expectancy situation, you’ll want to exploit it by looking for as many opportunities going forward as possible.
- For example, if you have a strategy that you often use on a specific time-frame (say, 60-minute chart), then why not look for that same setup/strategy on a lower or higher time-frame as well.
At the heart of all trading is the simplest of all concepts – that the bottom-line results must show a positive mathematical expectation in order for the trading method to be profitable.” ~ Chuck Branscomb
Frequency
Trade frequency represents an opportunity for profit. This figure tells what % of total trades fall in a specific category.
- It is important to remember that a high Expectancy system may not produce as much profit as a more active (higher frequency) system that has a lower overall Expectancy.
General Product Terminology
Trading Terminology used in the various sheets of the TJS product.
ATR
Average True Range – is a technical analysis volatility indicator that tells the degree of price volatility. The developer, J. Welles Wilder, recommends a 14-period smoothing ema.
- Referenced in the: Analysis sheet > Exit Strategy > Code/Description
- – used as an example (only), and can be modified by typing a new Code / Description over it.
Cumulative P&L
Each TJS product has a “Cumulative” P&L column.
- It totals all Profits and Losses by successive addition.
Drawdown sheet
Reduction in account equity from a trade or series of trades.
- A trader must look at the drawdown of their system and the amount of cash they have on hand. This will drive the amount of capital that can be used per trade, and their respective stop loss.
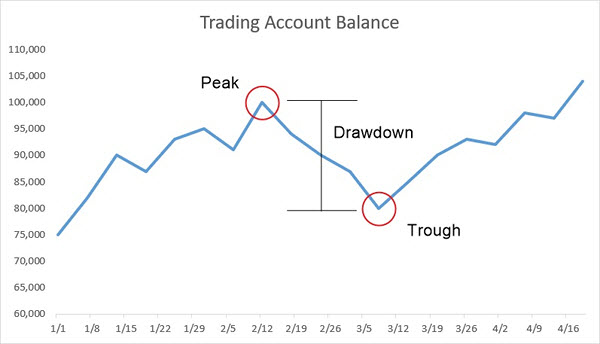
Drawdown (as referenced in the Trading Log)
This is the peak-to-trough decline during a specific period of trades, expressed as a percentage between the peak and the trough.
It is measured from the time a retrenchment begins to when a new high is reached.
- This method is used because a valley can’t be measured until a new high occurs. Once the new high is reached, the percentage change from the old high to the smallest trough is recorded.
- Note: Max DD and Avg DD cells may not populate until after a string of trades have been recorded (and exited), and you may see these calculations (in the Trading Log) disappear from time to time as new results are being established.
"Edge"
In pertaining to the TJS products, your ‘edge’ can be defined as this: “The TJS will give you the statistical analysis necessary to form the basis of all future decisions you make for your trading business.
Simply put, your ‘edge’ is gaining the confidence knowing your trading plan is working in specific Performance-tracking categories, or knowing when certain aspects of your plan need to be refined, or abolished.”
When trading with ‘confidence’, you are…
- More apt to pulling the trigger each and every time you are presented with an opportunity that your analysis states has a positive expectancy.
When trading with ‘confidence’, you have…
Information to back your decisions; You can justifiably allow for more risk to be taken on those trade-types, gradually increasing your profits over time. Conversely, you will know what is (taking away) from your bottom-line so your focus can remain on what is working.
Equity
“Open & Closed” equity calculations – does not apply to Forex, (and/or) should not be used if trading different quoted currencies within the same Trading Log.
- The ‘Open‘ equity field simply displays how much you stand to lose based on all open trades and how much they will cost you, minus the amount you’d lose if you entered a stop-loss. So, if you have a money management rule saying that you cannot risk more than a specific amount (total cumulative amount for all open trades), then this calculation will help you. However, If you don’t enter stop-loss prices in the Trading Log, this figure may not be of much use, as it will assume you’ll hold on to your position until it reaches zero.
- The ‘Account‘ equity field simply takes the difference between all Open and Closed trades.
- The ‘Closed’ equity field will not display once it detects a break in sequence (e.g. an open trade in between two closed trades). It will resume calculating when the next succession of ‘closed’ trades have been recorded.
– To get around this, simply click the “Sort” button, found in the Exit Date box (row 15)
Equity curve
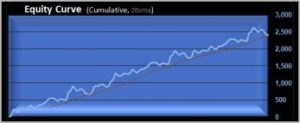 The value of a trading account graphed over a period of time. An Equity-curve gives a visual performance measure of a trading system. The Equity-curve in the TJS product calculates the Net Cumulative P&L figures.
- It is the goal of every professional trader to have a steadily rising equity curve, flowing from the lower left to the upper right, with only occasional shallow drawdowns – – When starting out, your curve will most likely look very jagged until you have a good amount of data recorded.
Futures (Contract Size) Multiplier
A variable Contract Size associated with a specific Futures symbol, market or instrument.
- This ‘multiplier’ is used for P&L calculations in the Futures TJS Trading Log.
- The ‘multiplier’ settings for each instrument are added (or modified) in the middle section of the Analysis sheet.
HFT "High Frequency Trader" mode
This is a function that allows HFT users to lock specific columns in the Trading Log, making the data entry process quicker by forcing the Tab key to skip over those columns.
The function will also hide specific columns in the Trade Summary section of the Trading Log, as well as hiding the Scatter Plot graph, as these columns (and graph) would no longer be useful to the HFT user.
Columns to be locked:
- Quantities, Prices, Times.
MFE / MAE / BSO
MFE:
The Maximum Favorable Excursion is a term used to measure how much a trade moves in your favor, from your Entry.
So, if your entry price on a long position is 34, and for as long as the trade lasted, the market moved in your favor to a price of 35.50, this represents an MFE of 1.50 (35.50 – 34).
MAE:
The Maximum Adverse Excursion is a term used to measure how much a trade moves against you, from your Entry.
So, if your entry price on a long position is 34, and for as long as the trade lasted, the market moved against you to a low price of 33.25, this represents a MAE of .75 (34 – 33.25).
BSO: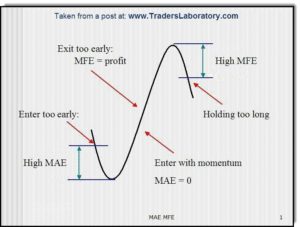
Best Scale Out. The closer your BSO is to the MFE, the better and more efficient your Exit strategy is… basically, not leaving too much money on the table.
If the gap between BSO and MFE is big, then you may have an issue taking your final target too soon and not letting your winners ‘run’.
Options Multiplier
A constant that is multiplied by the underlying share price or by the cash index value to determine the dollar value underlying the option.
- A default (100) multiplier is used in the Options Trading Log sheet, but can be changed easily in cell F9 or O8 (depending on version).
– Normally, this amount will remain “as-is”. However, different brokers in various regions around the globe may have different Options contract multipliers. If your region is not (100 shares per contract), please adjust this cell accordingly.
Pivot Trail
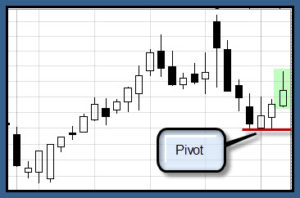 A logical location method of placing a Stop-loss or Trail-stop just over/under a Swing high/low (a.k.a. Pivot Point).
Referenced in the:
- Analysis sheet > Exit Strategy > Code/Description.
Position Sizer
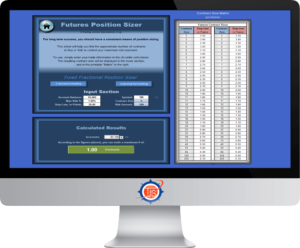
Each TJS spreadsheet has a sheet called the Position Sizer. Each is based on a common Money Management style, called Fixed Fractional. The premise is that you should never place all of your money on a single trade, but rather a specific amount that allows for maintainable drawdown scenarios to occur.
Fixed Fractional trading sets limits to how many (shares, contracts, units) you can purchase, based on a percentage of your account (usually <1 to 5%).
If you deem certain strategies have a much greater edge than others – it may be ideal to increase the percentage for those, and decrease for others that are being tested or have not proven themselves in real-world trading.
- Without a way to manage your risk on each trade, you risk losing everything.
Quote Currency
The second currency quoted in a Forex currency pair.
- For example, if trading the CAD/USD currency pair, the Canadian dollar would be the Base currency, and the U.S. dollar would be the Quote currency.
R-Multiple
R is simply the ‘dollar risk per trade’, or can be defined as a “fixed unit of Risk”. It’s nothing but a reward-to-risk ratio. If you risked $100 on a trade, and then made $200 dollars after the trade was closed, you made a 2 R profit. Conversely, if you stopped out of the play at your pre-determined stop (and assuming you share-sized properly), then you lost your original risk-amount, or 1 R.
“The golden rule of trading is to keep losses at a level of 1 R as often as possible and to make profits that are high R-multiples.” ~ Dr. Van Tharp of “Trade Your Way to Financial Freedom”.
Resistance
Resistance is a technical price level where sellers outweigh buyers, causing prices to bounce off a price ceiling.
- You may see this reference used in the “Analysis” sheet > Performance-tracking section(s).
Risk Amount
The amount of currency placed at risk on a given trade… a.k.a., “R”
- This coincides with “R-Multiple” (above).
ROI - Return on Investment
ROI, as seen at the top of each TJS Analysis sheet, is simply a performance measurement used to display your overall gain or loss result expressed as a percentage.
The calculation is as follows:
- (Current Value) – (Account Capital) / (Account Capital)
SQN (created by Van K Tharp)
System Quality Number (SQN): SQN = Squareroot (# Trades) * Avg R / Std Dev R
The SQN number can be interpreted as your overall trading “grade”. This data should not be deemed reliable until (> 30 trades). Stop Prices must be entered for each trade to be accurate.
Score: 1.6 – 1.9 Below average, but trade-able
Score: 2.0 – 2.4 Average
Score: 2.5 – 2.9 Good
Score: 3.0 – 5.0 Excellent
Score: 5.1 – 6.9 Superb
Score: 7.0 – Keep this up, and you may have the Holy Grail.
The calculation, use, and interpretation of the SQN is based on Van Tharp’s development of SQN. Only use if you are familiar with, and a proponent of Tharp and his teachings.
Support
Support is a technical price level where buyers outweigh sellers, causing prices to bounce off a price floor.
- You may see this reference used in the: “Analysis” sheet > performance-tracking section(s).
% Gain
The gain is the difference between the proceeds of selling the shares (contracts, etc.) and the amount paid for them. Fee’s are not part of this calculation.
- Not all market sheets have this calculation.