What’s in the product, you ask?
TJS Home Menu
“Where would you like to go?”
- The Home Menu allows you to jump to any of the TJS Elite product sheets, so navigating your way around the TJS is simple.
- Easily delete the markets you don’t trade (“All-markets” version, only).
- Have your own trading worksheets? Consolidate up to (6) of your own personal worksheets into the TJS Home Menu.
- There are two views: Condensed (show main sheets) and Expanded (show all sheets).

TJS Analysis
Modify it – Analyze what’s most important to ‘you’!
- The Analysis sheet displays pertinent stats “at-a-glance”, in an organized and easily understood way.
- Quick links are included in the Header to quickly jump to other corresponding market sheets.
- Filter your Analysis, by: Cumulative, Yearly, Monthly – and by: Gross & P&L, or PIPS & P&L (Fx), or POINTS & P&L (Futures)
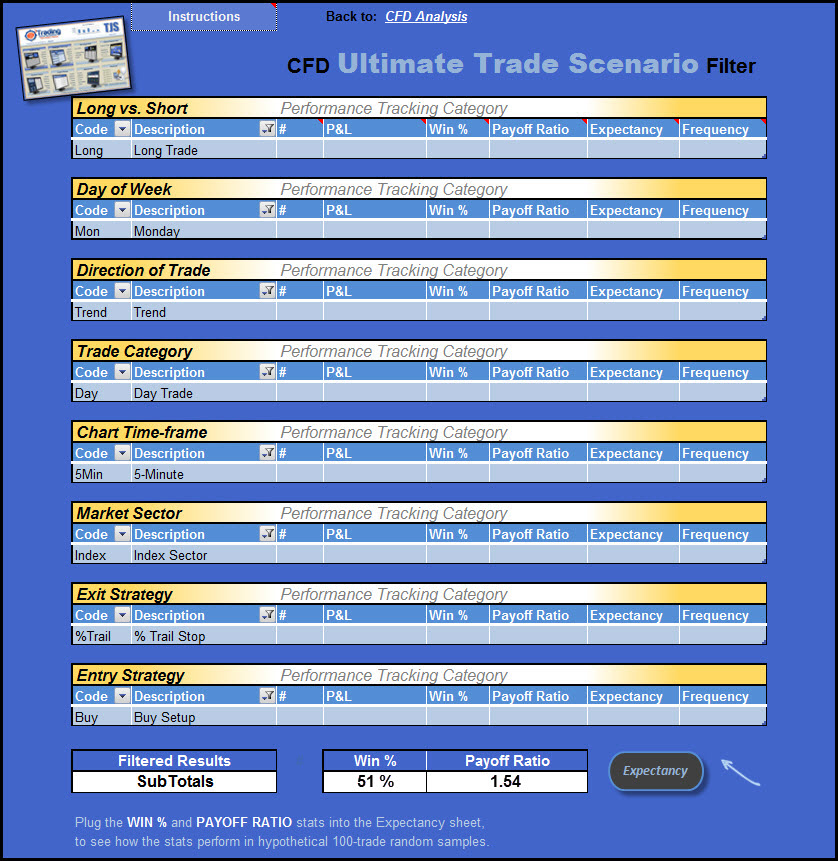
- Want to know your “Ultimate Trade Scenario”? With TJS Elite, you can!

Trading Logs
User-friendly design features, including:
- Fixed header, showing all Cumulative results.
- Navigation buttons to quickly skip to specific sections.
- No scrollbars needed!
- Equity-curve graph with filter buttons…
- for each Performance-tracking category.
- Scale In/Out price section. MAE/MFE analysis.
- Drop-down menus, and Error (input) detection.
- Comprehensive (per trade) analysis, with Journal / Notes section.
- (8) Personal columns for (optional) data.
- Each Trading Log comes complete with its own:
- Analysis sheet
- Candlestick Progress Chart
- Trade Review sheet

Accounts
Broker / Accounts sheet ledger.
List (up to 5) broker accounts and their corresponding account balances, then watch them automatically become part of your Trade-tracking experience.
You’ll also see them listed in the first column of your Trading Log(s), allowing you to easily tag each trade by which broker it was transacted from. The built-in pie graph displays a monetary ‘visual’ for each account. There’s also a dedicated area to add custom links to each of your broker login pages. The essential stats you’ll receive:
- Total # of trades, per Account
- % Frequency traded, per Account
- Profit / Loss total, per Account

Candlestick Progress Chart
Your trade progress, displayed in a chart format!
Would you like to know what your Profit and Loss looks like graphed as a candlestick chart?
Now you can!
- Traditional Green/ Red Candlestick design.
- Displays: Open, High, Low, Close.
- Functionality to view both:
- Weekly and Monthly graphs.
- Profit and Loss is displayed on the left side of the graph.
- Dates are displayed at the bottom of the graph.
- Full reference data is displayed next to the graph.
- (not shown in images)

Trade Review
Easily view (and Review) your trade details
Each trade (row) has its own clickable link, and when clicked, it will take you directly to the Trade Review sheet. Once there, the sheet consolidates and displays all of the pertinent information from that specific trade.
Excel allows you to easily link saved images of your trades, and if you take advantage of that functionality, the Trade Chart Image section will attempt to locate and display the image.
- A handy Scroll button is included to go from trade-to-trade.
- Pop-up comments are included for quick and easy instructions.
- Quick links to get you back to the Trading Log or Home Menu sheets.
- Easily print your trades as well.
- Print parameters are pre-set.

Monthly Calendar
Record specific events that occur each month.
This is a secondary sheet, but some will find it useful, especially when used to remember things like:
- Upcoming earnings release dates
- Seminar dates
- Trade review reminders
- Reminder to call your Mom!
- Anything else you wish!
Just enter the Month and Year and the TJS Calendar will display the proper days for that specific month.

Expectancy Calculator / Graph
View your performance in 100-trade random samples!
Enter a couple stat related figures (gleaned from your TJS Analysis sheet), then watch the Expectancy formulator display your results.
The built-in graph displays a visual Equity-curve for each scenario, and each press of the F9 key on your keyboard runs a separate 100-trade sample, making it a great tool for running “what-if” scenarios.
- Compare the performance for each of your Strategies, etc., and get an equity-curve for each.
- Pop-up comments are included for quick instructions, and to understand what the information means to you.

Milestones
Keep track of significant events:
Helpful and informative information is included in each Milestones sheet, which is linked from each specific Trading Log.
Visual bar graphs are included for each event. There’s also a section where you can enter your own events (if needed).
- Highest R-multiple Trade (Win/Loss).
- Largest Single Trade (Gain/Loss).
- Consecutive Trades (Won / Lost).
- Consecutive Trades (Profit / Loss) streak.
- Various “Averages”: P&L, Qty, Risk Amounts, Reward-to-Risk.

Drawdown
Know your potential Drawdown & Loss Streak.
This is beneficial to know when implementing proper risk amount parameters.
- A basic, no-nonsense, easy to use matrix…
- Tells you how much equity you stand to lose based on your performance metrics, or even “what-if” scenarios.
- Determine the potential drawdown for all of your Performance-tracking categories.
- Find your Win % from the left-side column. The corresponding rows display your consecutive loss streak chances.
- A great tool to help create a winning trading system with a risk management approach in mind.

Position Sizer
What’s your proper (Share, Lot, Unit, Contract) size?
This sheet will calculate the correct number to purchase, based on a (fixed fractional) methodology and user-defined parameters.
- A “quick-glance” matrix is included. Print and keep nearby for reference, before placing your next trade!
- Print area is pre-set.

Scale In/Out
TJS can keep track of your Multiple Entries & Exits.
Some strategies call for Scaling In (and/or) Out of positions, opposed to an “All-in-All-out” approach. The TJS Scale In/Out function solves that issue, allowing you to keep all trades on one row of your Trading Log – which is necessary to get the type of expert analysis that the TJS Elite has to offer.
- Quick-links are included for seamless integration.

Let's view the rest of the sheets in your new TJS!
- Ultimate Trade Analyzer. Easily filter the “best of the best” from each of your Performance-tracking categories, to find your “Ultimate Trade Scenario”.
- Stats Dashboard. Easily view all of your Analysis sheet statistics in one place – for “All-Markets” users.
- Password Manager. A safe place for all your: Logins / Usernames, Passwords, 2FA, etc., along with account links and a notes section.
- Trade Sheet. For those who refuse to ‘record-keep’ while trading. Designed to write down pre & post trade notes and to mimic the header categories of the Trading Log. The Trade Sheet makes it easy to transfer your trade info (after the market session is over).
- Reporting sheet. Not used by most TJS users, but for those who wish to display their trades in Pivot-table form, the sheet is already prepared and ready for you to “Drag-n-Drop” your field lists.
- Goals and Progress. Wish to have a central location for writing down your Goals and Progress? Here it is. A progress pyramid link is included to gauge your progress during the various stages of your trading career.
- Trading Plan. A handy template is included in your TJS, or opt for the downloadable MS Word Trading Plan template (along with an example Trading Plan).
- Click to view individual Trading Log and Analysis sheet images: Stocks, Options, Futures, Forex, Spread Betting, CFD, and Cryptocurrencies
Let's start Tracking & Analyzing your trades, shall we?
