Getting Started - (KISS version)
Just show me the basics, as quickly as possible please!
Downloading your TJS…
Make sure to Save your TJS to a familiar file location so you know where to access it. If you don’t specify a location, your browser will likely save it to your default “Downloads” folder. Now make a Blank/Backup copy, preferably one that’s not stored on your computer (in case of hard-drive failure).
Optimize the View…
Use the Excel Zoom control (usually at the bottom-right of your Excel app) to attain your best view for each sheet. Once you Save the file, your settings will be saved too.
The Home Menu…
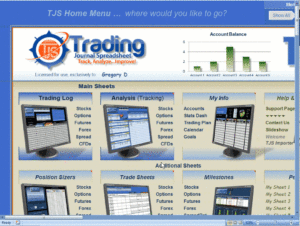
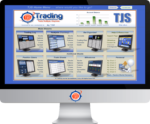 Your TJS will automatically display the TJS Home Menu each time you Open the file, but only after entering your Name in the Welcome page. Each section in the Home Menu has a pop-up comment attached to it. Read these to get familiar with each section. The Graph will display once you enter your Account Capital (we’ll get to that in a moment).
Let’s get organized…
Deleting markets (for “All-markets” users):
While in the Home Menu, scroll down until you see the “Delete” buttons. Click a button to delete a specific market. Once done, all sheets and references of that market will be completely deleted from your file. *may not work for some Mac users.
Broker / Accounts:
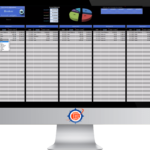 While in the Home Menu, click the “Accounts” link (under “My Info”). Once there, read the instructional pop-up message, and then enter your Account name(s). By doing so, you’ll be able to view basic analysis stats for each account. The bottom ledger section is optional (read pop-up message for clarification).
Do you need the “Trade Sheet“?
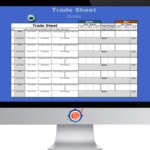 If you don’t wish to keep your TJS open during the trading day, then we advise making copies of the Trade Sheet. This way, you’ll have a perfect note-taking sheet that you can use to jot down your daily trade specifics.
Analysis sheet…
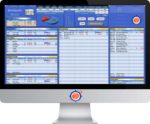 From the Home Menu, click on an Analysis sheet link. Each section already has data in it, but you’ll likely wish to modify it, to analyze what’s most important to you. All Yellow header sections, and the Codes and Descriptions underneath them – can be changed – just click in the cells and retype! The Codes will end up in the Drop-down menus in your Trading Log.
Trading Log…
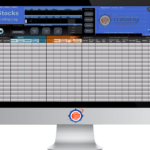 Beginning Account Capital:
In the Home Menu, click on a Trading Log sheet link. Once there, click the “Journal & Settings” button (left-side Header section). Now, locate the “Beginning Account Capital” section, and then enter the amount of capital that is in your broker/account at the time you start your Trade-tracking. Any adjustments (Deposits and Withdrawals) can be entered in the column below it.
Entering trades:
In the Trading Log, you’ll see two sections:
1) The Header section (at top) displays all Cumulative trade results. The “Toolbox” section is to the right (beyond the Equity-curve graph). View the pop-up instructional comments in that section for quick tips on what the Toolbox section can do for you.
2) The Trading Log section is where you’ll enter your trades. Start in row 18, and use your TAB key to go from left-to-right. The “Tracking Codes” section (under graph) are the Codes you set up in the prior step (Analysis sheet modification). Use the drop-down menus to ‘tag’ your trades according to their Performance-tracking category; this way, they’ll appear in the Analysis sheet…
ANALYSIS sheet (view Stats)…
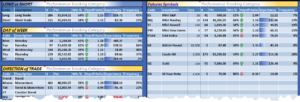
Once you start Closing out your trades, go to the Analysis sheet to view your results. When a large enough data-sample is present, you’ll start to see patterns of Strength and Weakness. Pay close attention to your Expectancy column. This is how much (on average) you are gaining (or losing) based on your past performance.
To view more about your Performance (and/or) Terminology used in this (or any other sheet), click the Terminology button in the top-header section of the Analysis sheet.
Additional sheets…
After getting acquainted with the main sheets (Trading Log, and Analysis), feel free to view the other sheets in your Home Menu to see if they will be useful to you. Each sheet has an instructional message at the top.
Thanks for viewing!
Getting Started guide - 9 step (with Images and Videos)
Each expanding Toggle is a separate section.
Each section is meant to be viewed in the order you see them.
1) Save and create Duplicate file copies
After downloading your TJS…
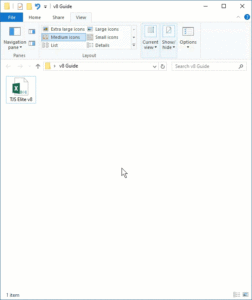 Make sure to Save it to a familiar file location so you know where it is. If you don’t specify a location, your browser will likely save it to your default “Downloads” folder.
It’s recommended to save your TJS to a Cloud-based storage location (like OneDrive or Dropbox), especially if you’re a Windows user who’d like to share their file on multiple computers (PC, Laptop, etc.), which means it will always be Saved, Backed-up and Synced no matter what computer you’re accessing it from. You can save it to your desktop as well, but please have a means to back it up in case of computer failure.
Make a Blank/Backup copy. Additional copies are useful for: Live Journal, Practice Journal, Backup Journal, etc. Creating a blank Backup file can be useful if you ever plan to start ‘anew’.
- Click image to view a short video example >>
The cursor in the example is performing a right-click of the mouse.
2) Optimize the View
Easily adjust your sheet sizes for optimum viewing pleasure!
 Depending on what size screen monitor you are using, you may wish to optimize the view for each sheet in your TJS. After you find your optimum setting, whereas you can view as much as possible without the text being too small to read it, just Save the file. Excel will remember your settings going forward.
- Click image to view a short video example >>
3) The "Home Menu"
While in the Home Menu…
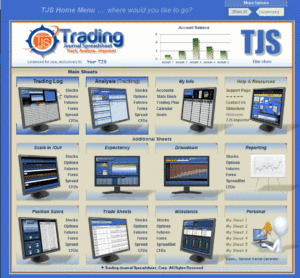 Hover your mouse cursor over the small red triangles for a quick peek in to what each section represents to you. The blue text (next to the images) are the links you’ll use to get to corresponding sheets within the file.
No matter which TJS sheet you are in, you will see a button that looks like a (mini) Home Menu – found near the top-left of each sheet. Clicking it will get you back to the the Home Menu.
The Trading Log and Analysis sheets have their own “quick” links, (in the form of: Square, Oval or Arrow buttons) to get you back and forth between their own corresponding sheets.
FYI… each time you open your TJS, it will open to the Home Menu.
- Click image to view a short video example >>
4) Let's get organized!
Deleting markets (“All-markets” users):
 If your TJS has multiple markets, you may want to delete those markets that you don’t plan to trade. This will allow you to focus only on the markets that pertain to you. This function is found underneath the Home Menu (scroll down until you see the Delete buttons). *may not work for some Mac users.
- For U.S. based traders, the UK Spread Betting and CFD markets are traded (only) overseas.
- View the short video example >>
Broker Accounts
 While in the Home Menu, click the Accounts link (under “My Info“). Once there, read the Instructional pop-up message, and then enter your Account name(s). The gray ‘ledger’ section is optional, however you should enter your Account/Broker name(s) in the Blue boxes so you can compare the stats between each of them. The Stats will be displayed in the right-side of the Analysis sheet(s).
- View the image example >>
Recording trades (now or later)
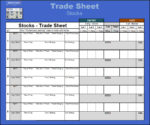 You may want to decide now if you’ll be logging your trades during the trading day. If so, just keep the TJS Trading Log open while you trade, then simply log your trade info as you go.
If you see this being a distraction while trading, we suggest you print the Trade Sheet, and then make copies so they’re at your disposal when needed. Each box in the Trade Sheet corresponds with the entry columns in your Trading Log, making it easy to take the appropriate “Notes”.
- You can access the Trade Sheet from the bottom row of your Home Menu sheet.
- Click image to view a Trade Sheet example >>
5) Modify your Analysis sheet
From the Home Menu, click on an Analysis sheet link.
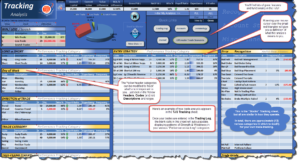
Once there, you’ll notice that each section is already filled out. The data you see is considered common data that most traders find helpful. However, we fully intend for you to modify your Analysis sheet so that it analyzes what’s most important to YOU! Treat it as an extension to your Trading Plan (if applicable).
- Click image to view example >>
They Yellow header categories can be changed to track something totally different – just click in them and retype. Same goes for the Codes and Descriptions underneath them – just click and retype.
- The Codes will end up in the Drop-down menus in your Trading Log, enabling you to easily ‘tag’ each trade accordingly.
- Quick-link buttons are in the top-header section to get you quickly to the corresponding Trading Log (and other sheets).
- Filters are included to view your analysis by: Cumulative (all) trades, Monthly (and/or) Yearly, as by either Gross or Net P&L.
- If you prefer a short video and listening to a catchy tune, watch “Modifying Your Analysis Sheet” on YouTube.
6) Beginning Account Capital
In the Home Menu, click on a Trading Log link.
Once there, click the “Journal & Settings” arrow/button (next to Home Menu button in the top-left section), and then in cell AU14 (AW14 in the Forex sheet), enter your Beginning Account Capital — most likely the amount of capital that’s in your broker/Account at the time you start your Trade-tracking. Please know, this is optional and won’t affect your trade-tracking metrics in the Analysis sheet(s). You can always come back later to do this, or just leave it blank.
If you do enter your Beginning Account Capital, it will be mirrored at the top of its corresponding Analysis sheet, providing a basis for other calculations, such as:
- Current Value
- Value Difference
- ROI (Return on Investment %
You can record any “adjustments” (Deposits/Withdrawals) in the same Trading Log section – column AU14 (AW14 in the Forex sheet). Make sure to use the minus (-) key when entering withdrawals.
- You can also enter a transaction comment in the same cell. Just Unprotect the sheet, and then right-click in the cell and choose “Insert Comment”.
Here’s a short video ⇓
7) Entering your trades
In the Home Menu, click on a Trading Log link.
Once there, you’ll notice two distinct sections: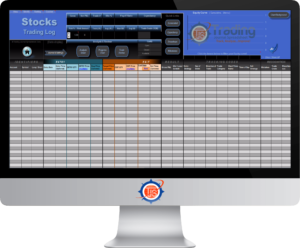
1. The top Header section displays your results for all Cumulative trades, along with an Equity-curve graph to visually display your cumulative P&L.
In the right-side section of the Header, you’ll see the Toolbox & Settings section. When you see a little red triangle, it means there is a pop-up comment in that section, to provide helpful: hints, tips or instructional messages.
2. The lower Log (ledger section) is where you’ll enter all trades. Start on Row 18. Each cell in this top row will display a message to guide your trade input. Use your keyboard TAB key to scroll from left-to-right. Row 18 will display pop-up messages for clarification. Rows 19 and below, will not display the pop-up messages.
Some columns will have drop-down menu arrows displaying various input choices, which come directly from the Codes & Descriptions that you set up in the Analysis sheet.
Most of the columns that hold formulas will be protected, making it easy to skip these columns when using the TAB key. To gain access to protected cells/columns in the Trading Log, just Unprotect the sheet (no password needed).
Once a trade is Closed (with an Exit Price and Exit Date) the top-header will update, and the Analysis sheet will populate each trade that has been ‘tagged’ in the “Tracking Codes” section (directly underneath the Equity-curve graph).
Videos:
- Standard trade entry (all columns)
- Allows you to view the (per trade) metrics in the Yellow “Trade Summary” section.
- HFT “High Frequency Trader” entry
- Streamlined entry process (requiring a manual Gross P&L entry), but saves time if you don’t need the (per trade) metrics.
Options, Forex, Crypto and Spread Betting traders… for additional Trade Input help (if needed), please click the instructional “Help” link at the top-left of the Trading Log.
8) Analyzing your trades
Strengths & Weaknesses! … What are yours?
If you’re anything like us at TJS, the process of watching your trading efforts unfold will actually be fun. In fact, it’s really what this product is all about… cultivating data from the Trading Log into meaningful information in the Analysis sheet.
After a string of trades have been recorded (for any specific Category), you can start analyzing the information to see where your Strengths & Weaknesses are.
Our advice is to view the Expectancy figures in each Performance-tracking category. If any category has (10 to 20 minimum # of trades), then:
For consistently losing categories…
- Determine if there is still potential to keep trading those types of trades. It may not be worth the effort if you have categories that are producing consistent winning results.
For consistently winning categories…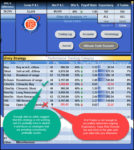
- This is where your future focus and efforts should be. In fact, exploit those opportunities and find ways to increase the frequency of consistently profitable strategies (different Time-frames, Markets, etc.).
- Click image to view an example >>
For more detailed information on TJS Analysis, please visit the TJS Performance & Terminology page,
– also linked from inside your TJS Home Menu –
9) Let's wrap it up...
Additional sheets…
You’ll see additional sheets in your TJS Home Menu that we did not cover here. This is by design, as not all traders will find every sheet useful for their style of trading. However, we do encourage you to view them at your leisure to see if they’ll be helpful to you. Do this (only) after setting up your Analysis sheet and getting comfortable with your Trading Log, which are the heart of the TJS!
Reminder…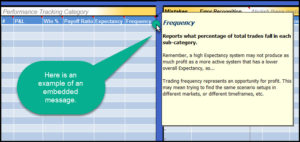
Additional Tips and Instructional messages are displayed throughout the TJS product sheets, found in the form of little embedded messages. Access them by hovering your mouse cursor over any cell with a little red triangle.
- View the image example >>
Please know…
The TJS workbook and (most) sheets are code-protected. Why?… much of the data is used behind the scenes and any amendments made to it may corrupt the integrity of the calculations that use it. The protection is also to help care for the many thousands of hours the developer has put in to his intellectual property rights. Thank you for not requesting a password to unlock any portion of the TJS.
The Trading Log is not code-protected, allowing advanced users to: Customize the table, and to access, modify or add their own formulas, etc. Troubleshooting modified sheets may incur a labor charge, so please be careful if you choose to do so.


